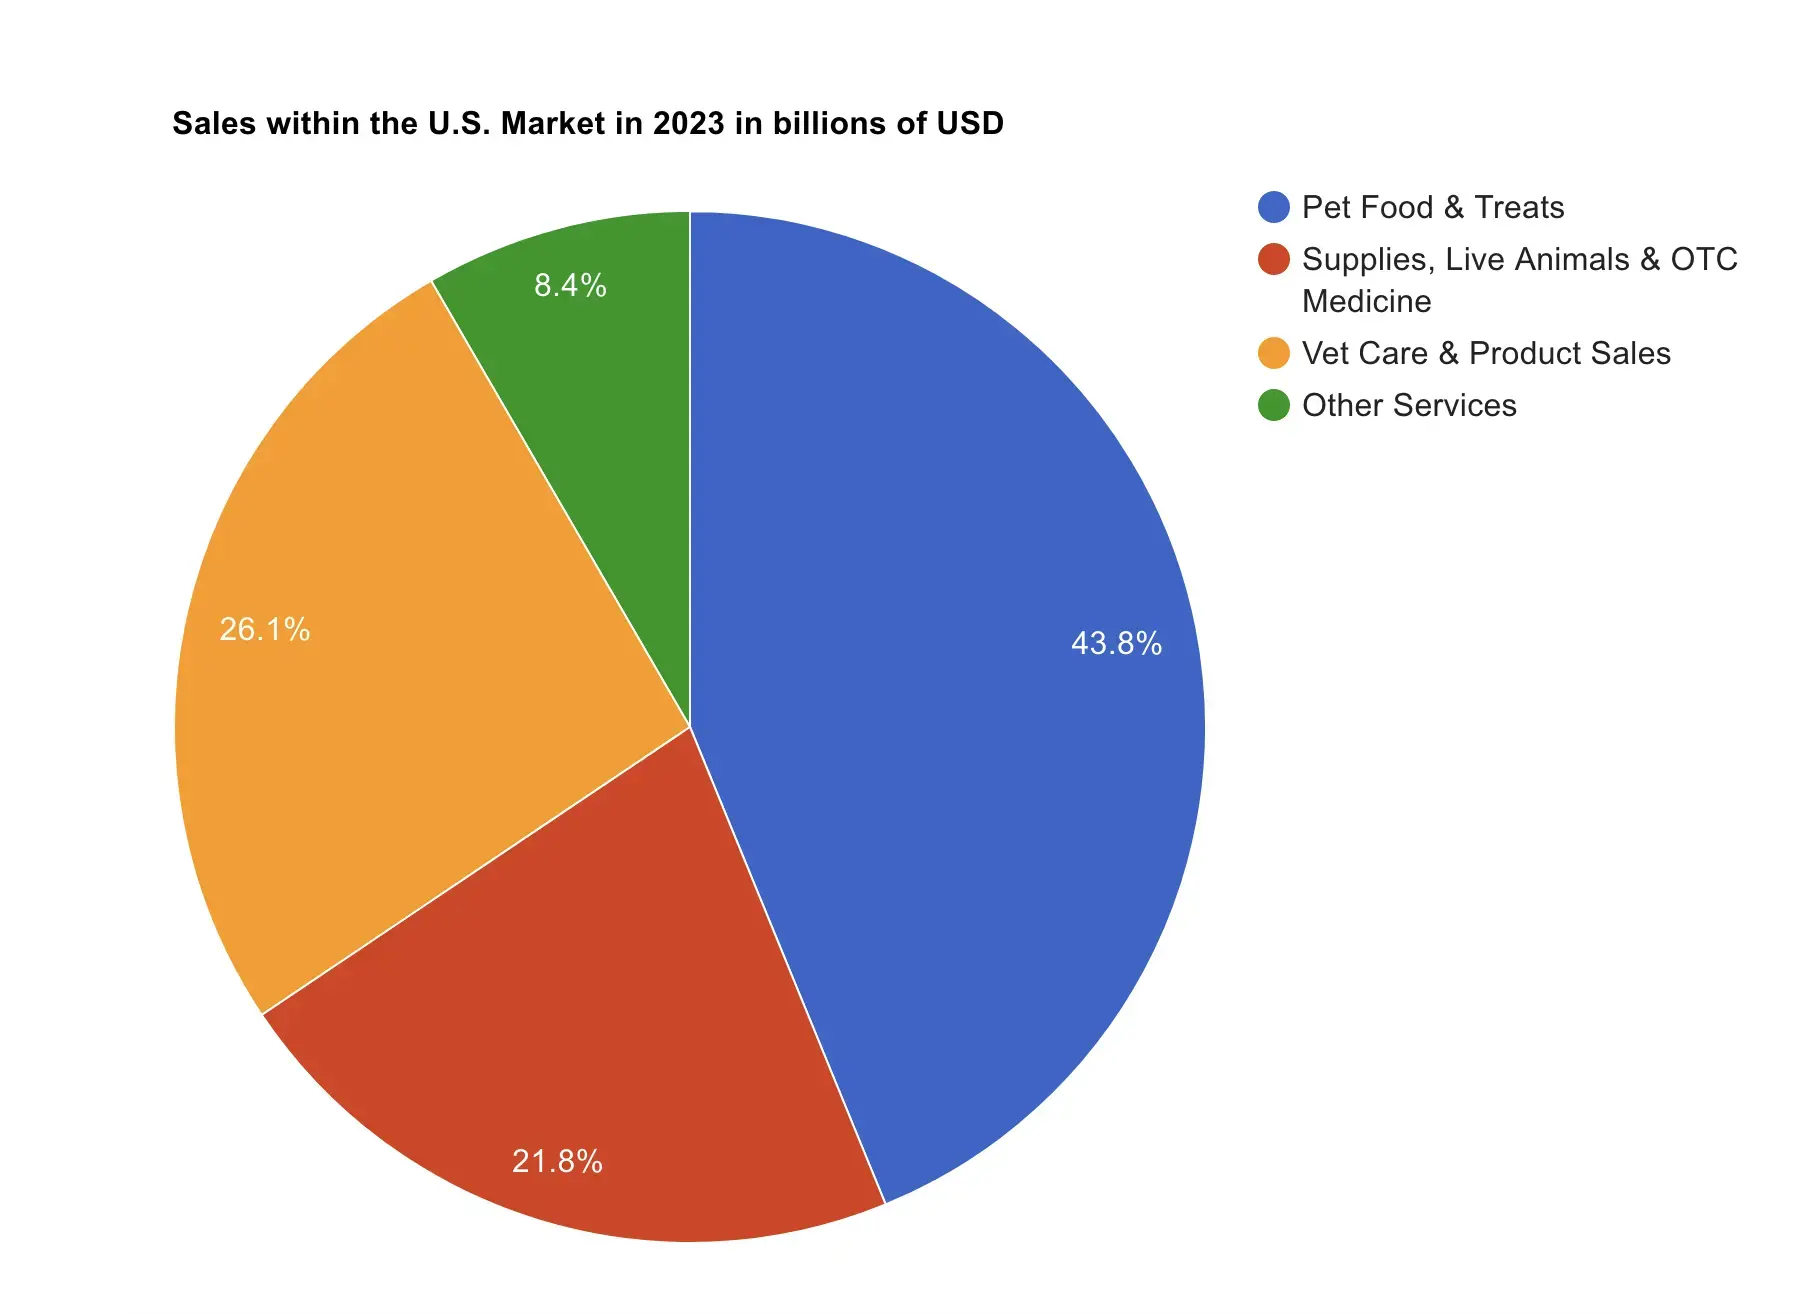
- slide1: Sales within the US by category (image attached)
- slide2: Average amount spent on cats & dogs in past 12 month
- slide3: Pet ownership, household count
- slide4: Pet ownership by generation
- slide5: Petco quarterly revenue by category
News about and pertaining to the United States and its people.
Please read what's functionally the mission statement before posting for the first time. We have a narrower definition of news than you might be accustomed to.
For World News, see the News community.
This community's icon was made by Aaron Schneider, under the CC-BY-NC-SA 4.0 license.
Kind of hate slide 1. There's no point in specifying 'in billions of USD' if you're only including percentages. The entire pie chart could represent a trillion dollars, or $25, and they wouldn't have to change a single thing about it.
Edit: Ah, I see, you can hover over them to see the values. Useless as a static image and useless on my phone.
correct, static image and phone doesn't show absolute number