8
submitted 1 month ago by [email protected] to c/[email protected]

link to complete data slides

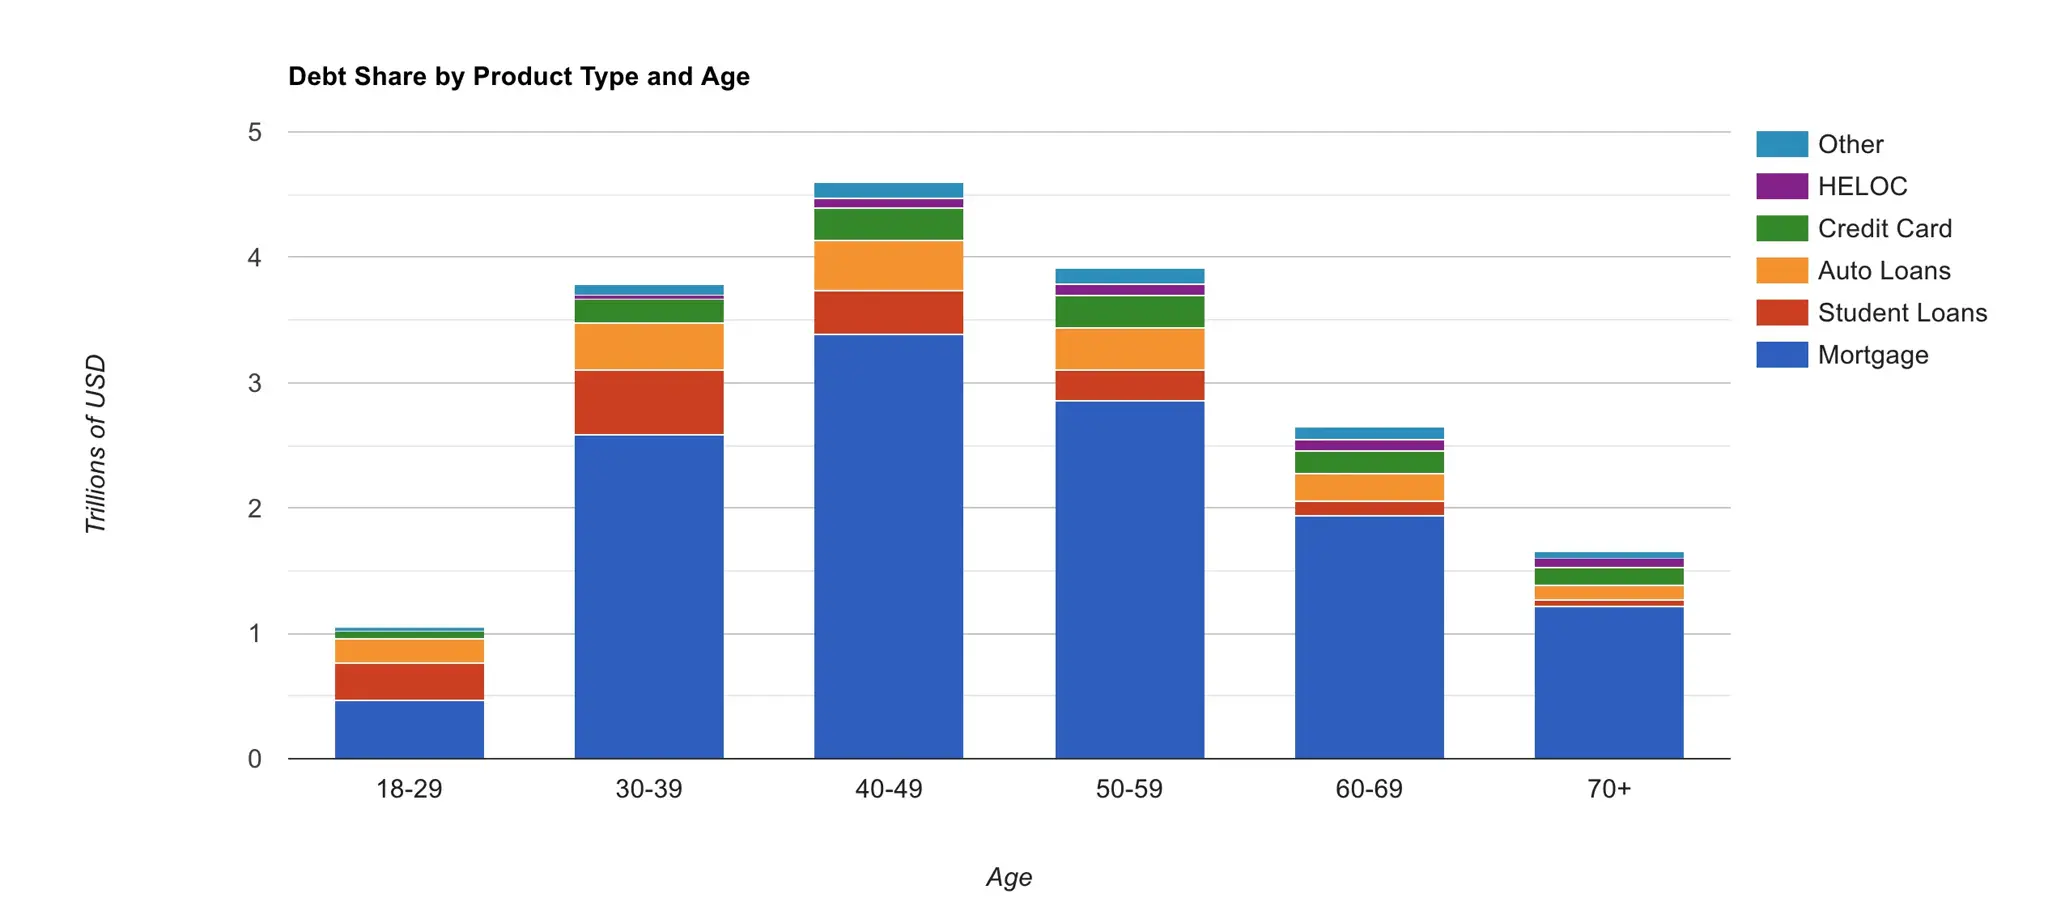
  • slide1: Debt Share by Product Type and Age, 2024Q1 (image attached)
  • slide2: Debt balance vs GDP per capita, state
  • slide3: Mortgage debt balance per capita in selected state
  • slide4: Auto loan debt balance per capita in selected state
  • slide5: Student loan balance per capita in selected state
  • slide6: Credit card balance per capita in selected state
[-] [email protected] 1 points 1 month ago

correct, static image and phone doesn't show absolute number

17
U.S. Pets Economy (beehaw.org)
submitted 1 month ago by [email protected] to c/[email protected]

data slides

  • slide1: Sales within the US by category (image attached)
  • slide2: Average amount spent on cats & dogs in past 12 month
  • slide3: Pet ownership, household count
  • slide4: Pet ownership by generation
  • slide5: Petco quarterly revenue by category
9
submitted 1 month ago* (last edited 1 month ago) by [email protected] to c/[email protected]

Data slides

  • slide1: rank of net assets
  • slide2: expense vs income
5
submitted 1 month ago by [email protected] to c/[email protected]

Data slides

  • slide 1: operating income by category
  • slide 2: operating income vs expense (screenshot attached in post)
[-] [email protected] 1 points 1 month ago

the pie chart aggregate offshore real estate wealth owned by top economy based on GDP, US is one of them checkout data slides for list of economies owning real estates in those cities

14
submitted 1 month ago by [email protected] to c/[email protected]

Data slides

Owner, City, Value in bn USD

  • ...
  • UK, Dubai, 10.338
  • US, London, 6.521
  • US, Paris, 6.436
  • ...
41
submitted 1 month ago by [email protected] to c/[email protected]

Data slides

Corruption perceptions Index

  • Germany: 78
  • Canada: 76
  • ...
  • Mexico: 31
  • Russia: 26
12
submitted 2 months ago by [email protected] to c/[email protected]

data slides

  • chart1: Chancellor of Germany, 1982-2021
  • chart2: Parliamentary elections, 1990-2021
15
I love mom! (beehaw.org)
submitted 2 months ago by [email protected] to c/[email protected]

I love mom! - link to calendar chart

5
submitted 2 months ago by [email protected] to c/[email protected]
  • 2021q1, GDP: 5.2, sqft: 3.1
  • 2021q2, GDP: 6.2, sqft: 3
  • ...
  • 2023q1, GDP: 2.2, sqft: 2.5
  • 2023q2, GDP: 2.1, sqft: 2.3
  • 2023q3, GDP: 4.9, sqft: 3
  • 2023q4, GDP: 3.4, sqft: 3.6

data slides with visualization

[-] [email protected] 2 points 2 months ago

and the source provide price for EU as a whole instead of individual country

[-] [email protected] 1 points 2 months ago

yes, you are right, I didn't find hourly minimum wage rate for most of EU...

[-] [email protected] 3 points 2 months ago

well, beehaw does not support interactive chart experience ... image is static

17
submitted 2 months ago* (last edited 2 months ago) by [email protected] to c/[email protected]

Checkout details in data slides

  • slide 1: Geo price in USD (image attached)
  • slide 2: Price list (in USD) & change in last 6 months
  • slide 3: Working hours to afford a big mac, price / hourly minimum wage
[-] [email protected] 1 points 2 months ago

check out sub-category in slide2 through link

49
submitted 2 months ago by [email protected] to c/[email protected]

Checkout details in data slides

slide 1: funding by category slide 2: funding by sub-category slide 3: top 20 funded program

[-] [email protected] 2 points 2 months ago

Yes, you are right. Using AI to make up jokes is a joke. Human does better.

14
submitted 2 months ago by [email protected] to c/[email protected]
view more: next ›

data_graffiti

joined 4 months ago