-7
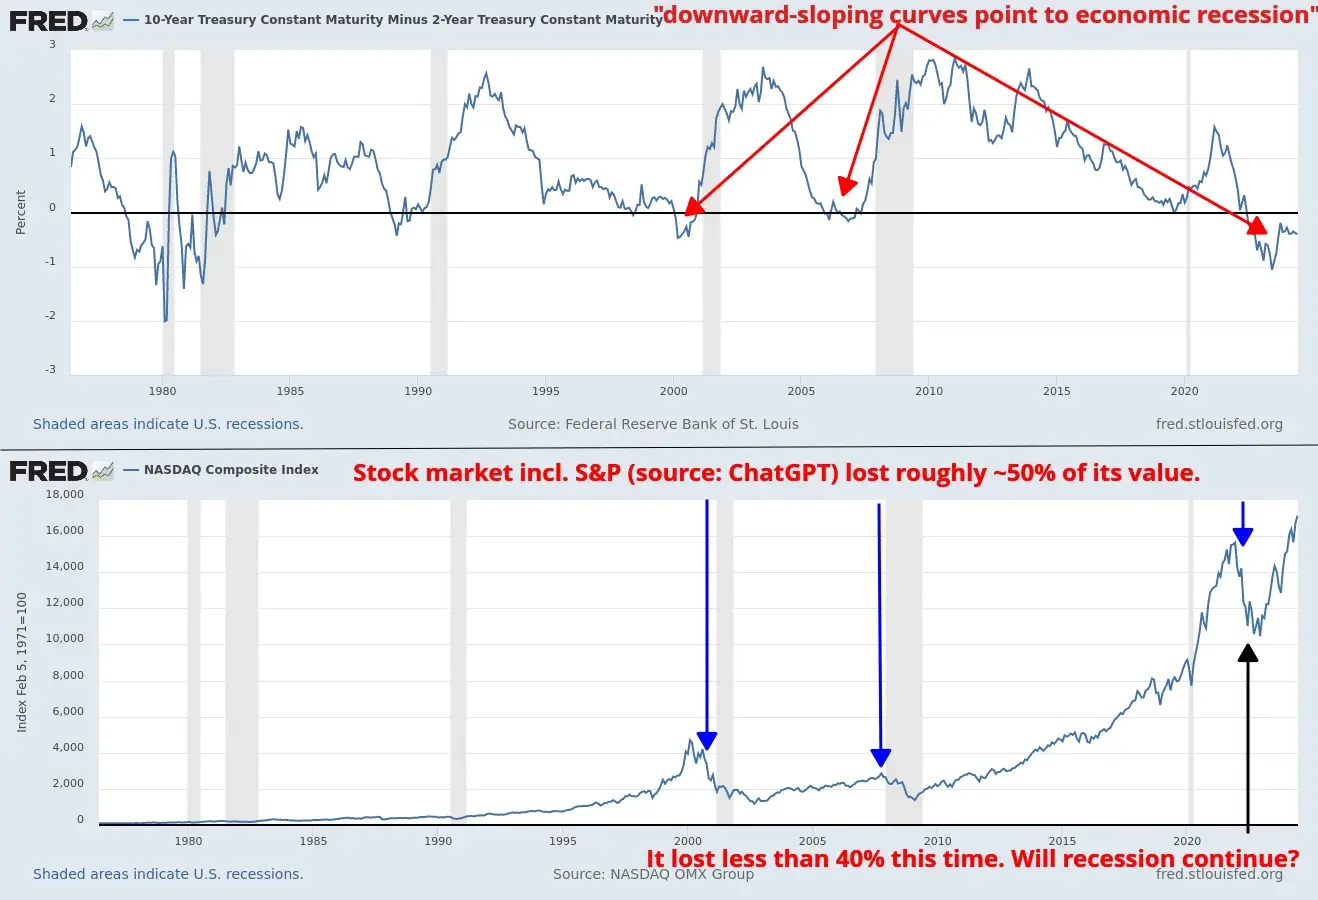
Inverted US bond yield curve is usually followed by economic crysis... Has 2022 market downturn/economic crysis ended in 2023/2024 or?
(lemmings.world)
přeposláno z: https://lemmings.world/post/10202534
Do i get it right on the attached image? IMO it shows US bond yield inverted curve and the subsequent economic recessions (which follows this market indicator) on all time chart. sources:
https://fred.stlouisfed.org/series/T10Y2Y
https://fred.stlouisfed.org/series/NASDAQCOM
https://www.investopedia.com/terms/y/yieldcurve.asp
According to https://www.currentmarketvaluation.com/ the market is overvalued to strongly overvalued, so i am wondering if this crisis, that started in 2021/2022 is a longer crisis, which not yet ended and the overvalued stock price will fall down again? But more importantly, if I have misunderstood something wrong, please explain why.