this post was submitted on 25 Jun 2024
9 points (100.0% liked)

Aotearoa / New Zealand

1603 readers
1 users here now

Kia ora and welcome to !newzealand, a place to share and discuss anything about Aotearoa in general

Rules:

FAQ ~ NZ Community List ~ Join Matrix chatroom


Banner image by Bernard Spragg

Got an idea for next month's banner?

founded 1 year ago
MODERATORS
 

Last weeks thread here

Welcome to this week’s casual kōrero thread!

This post will be pinned in this community so you can always find it, and will stay for about a week until replaced by the next one.

It’s for talking about anything that might not justify a full post. For example:

  • Something interesting that happened to you
  • Something humourous that happened to you
  • Something frustrating that happened to you
  • A quick question
  • A request for recommendations
  • Pictures of your pet
  • A picture of a cloud that kind of looks like an elephant
  • Anything else, there are no rules (except the rule)

So how’s it going?

top 34 comments
sorted by: hot top controversial new old
[–] [email protected] 5 points 1 month ago (4 children)

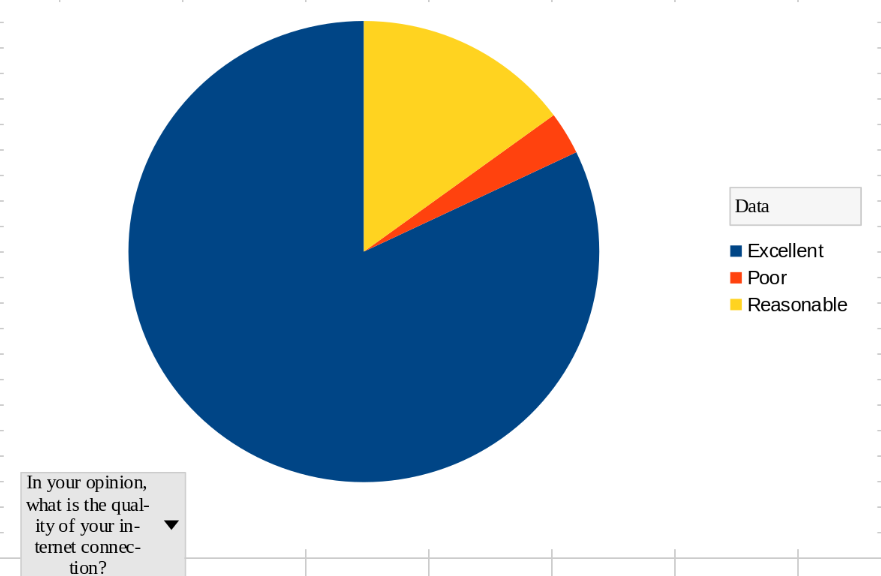
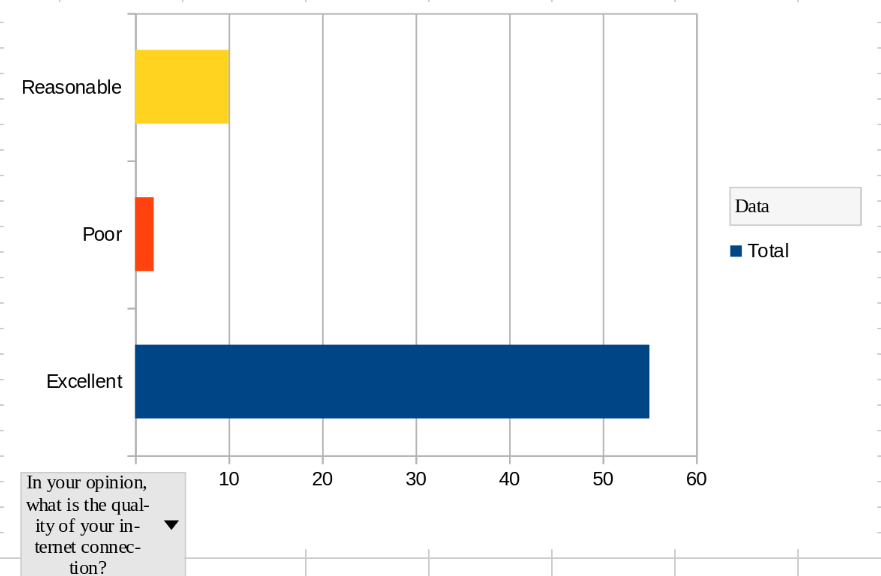
I thought I'd better post an update about the Lemmy.nz census. I have been working on analysing the data and writing a post, but there's probably still a while before I'll be done. There's quite a lot to get through.

Also, if anyone knows any good tools for generating graphs then let me know! I'm using LibreOffice Calc as an excuse to learn how to use it, and it's graphs aren't that great. I can break out Excel if I have to but to be fair Excel graphs aren't much better.

[–] [email protected] 4 points 1 month ago* (last edited 1 month ago) (1 children)

You could do this with python and a couple of libraries. This is just an example, but you could import the data from a DB or use a CSV file.

import matplotlib.pyplot as plt
import numpy as np

# Pie chart data
labels = ['Category A', 'Category B', 'Category C', 'Category D', 'Category E']
sizes = [30, 25, 20, 15, 10]
colors = ['#ff9999','#66b3ff','#99ff99','#ffcc99','#c2c2f0']

# Pie chart
plt.figure(figsize=(8, 8))
plt.pie(sizes, labels=labels, colors=colors, autopct='%1.1f%%', startangle=140)
plt.title('Sample Pie Chart')
plt.axis('equal') # Equal aspect ratio ensures that pie is drawn as a circle.
plt.show()

# Histogram data
data = np.random.normal(0, 1, 1000) # Generate 1000 random data points with a normal distribution

# Histogram
plt.figure(figsize=(10, 6))
plt.hist(data, bins=30, color='#66b3ff', edgecolor='black')
plt.title('Sample Histogram')
plt.xlabel('Value')
plt.ylabel('Frequency')
plt.show()

[–] [email protected] 2 points 1 month ago (1 children)

Ooh thanks! I'll definitely have a play with this. What's the step before this? Is it as simple as installing python, putting the code in somefile.py, then running it?

[–] [email protected] 3 points 1 month ago* (last edited 1 month ago) (1 children)

Yep, if you are running any type of Linux python is already installed.

I always have a path in my python files to allow for direct running rather than calling python first. This only works on Linux.

If you put
#!/usr/bin/env python3
as the very first line, you can make the file executable and it will just run

otherwise you will have to call python first, e.g. python yourFile.py

[–] [email protected] 1 points 1 month ago

Awesome, thanks! I'll have a play with this over the weekend.

[–] [email protected] 2 points 1 month ago (1 children)

Just roll with the LibreCalc charts.

It's the data that's important, perfectly rendered gradients on histogram bars is less important.

[–] [email protected] 1 points 1 month ago (1 children)

Mainly I don't like that the pie charts are hard to tell what is what. If there are 6 or 7 things and you have to tell which is which by colour, that's a bit tricky. Labels on the sections would be better, but I haven't worked out how to do that.

Maybe if I think a pie chart shows it best, I'll also include the bar chart so it's clearer.

[–] [email protected] 2 points 1 month ago* (last edited 1 month ago) (1 children)

Use a bar chart. Pie charts are for marketing and pizza.

Also, no one cares if a bar chart sums to more than 100% ;-)

[–] [email protected] 2 points 1 month ago (1 children)

I dunno. I feel something like this works better as a pie chart.

[–] [email protected] 2 points 1 month ago (1 children)

Pie charts tend to work when you have three to four categories, more than that they fall apart.

The nice thing about the bar chart is the axis label which can be the raw value rather than a percentage, having a large (7-8) number of categories is still readable especially if there minority categories.

Also, is all just my opinion, so don't let me stop you using whatever you like!

[–] [email protected] 2 points 1 month ago (1 children)

I think pie charts are also helpful for when you have 10 categories but two of them make up 90% of the result.

But your bar chart preference is noted, so I'll try to make sure to include them along side pie charts 🙂

[–] [email protected] 2 points 1 month ago (1 children)

Poor data visualisation is a pet peeve of mine and I'm disproportionately vigorous when talking about it ;-)

Especially after a few drinks with dinner.

[–] [email protected] 1 points 1 month ago

Haha one of my pet peves for data visualisation is graphs that don't start at zero. I get sometimes the movement is too small to visualise properly when you start from zero, but you can't probably understand the scale if you don't start at zero.

I bet you'll argue with me on that!

[–] [email protected] 2 points 1 month ago (1 children)

I'm curious, can we have something like automation in LibreOffice? I mean like in VBA, where I can pull data and export excel charts.

[–] [email protected] 2 points 1 month ago

LibreOffice Calc supports its own macro language as well as a subset of VBA! I recently converted an Excel macro to LibreOffice and it wasn't too painful.

[–] [email protected] 2 points 1 month ago* (last edited 1 month ago) (1 children)

Fudge, I forgot to complete it! I got halfway through and started having an existential crisis about my identity ha ha and thought I'll come back later and fix this.

[–] [email protected] 2 points 1 month ago (1 children)

Well in you hop then, while I'm sorting out how to do graphs. I've removed the expiry so you can finish your submission.

Anyone else can hop in too if you haven't done it, as long as you're quick 🙂

https://survey.lemmy.nz/index.php/493338?lang=en

[–] [email protected] 2 points 1 month ago (1 children)

Thanks! Done!

Great, I'm back to questioning my identity and I'd forgotten the other super hard question in there, dessert. 😃

[–] [email protected] 2 points 1 month ago

Haha I copied that from the Lemmy.ca one, I thought it would be interesting to see any differences!

If anyone else wants to do it and hasn't had a chance, I'll leave it open until tonight or whenever I next get back to doing the data analysis.

[–] [email protected] 4 points 1 month ago (1 children)

It's been a month since I started journey with Linux Mint as my daily driver. I enjoy tinkering with things like PulseEffects (trying to create similar sound effects as in Windows). Also tried to customize Conky, but I think I need to learn Lua.

I also found out that my setup without a swap file / partition. I guess it because I use btrfs for the root partition, so the Mint installer replaced swap with some tmpfs folders. I only realized after I got stuck in OOM. 😂😂

[–] [email protected] 2 points 1 month ago

One thing I learnt in making the jump to Linux as a daily driver is to keep all my documents and files on a separate partition. There are so many distros that I wanted to test a few, and I got sick of copying 600GB around all the time. Much easier to keep them separated on a partition away from the boot partition.

[–] [email protected] 3 points 1 month ago (2 children)

How come no one paired bubbly with ice cream for adult-spiders?

[–] [email protected] 2 points 1 month ago (1 children)

I did it when I was in my 20s a few times and I hated it. Tasted suspiciously like vomit.

However I did not give up there. The grown up spider/icecream soda involves tonic water, french vanilla icecream, crushed strawberries and a dash of gin, imo.

[–] [email protected] 2 points 1 month ago (1 children)

I like how you hated it so much, you tried it multiple times 😆

I can't stomach anything with tonic water. It must be an acquired taste because it's so bad.

[–] [email protected] 2 points 1 month ago (1 children)

What can I say, I was young and it feels like it should work so I kept thinking maybe the champagne wasn't good enough, maybe it works better with dry instead of sweet, etc.

If you hate tonic, maybe substitute one of those fancy Fever Tree club sodas then?

[–] [email protected] 2 points 1 month ago (1 children)

To be honest, the whole thing doesn't sound that appetising to me! I'm just not a big spider fan in general, so swapping the tonic probably wouldn't help.

[–] [email protected] 2 points 1 month ago (1 children)

Makes sense. I still really love plain lemonade ones, feels like a treat for me.

[–] [email protected] 2 points 1 month ago

Ok, maybe I'd go for a lemonade one if it was offered 😆

[–] [email protected] 1 points 1 month ago (1 children)

If you search with the term "ice cream float" instead of "spider", there are plenty of recipes!

E.g.

I'm not willing to try it since I don't like wine, but I encourage you to give it a go and report back!

[–] [email protected] 2 points 1 month ago

Thanks this is awesome! I won't share it with my wife, however

[–] [email protected] 3 points 1 month ago (2 children)

"15 Minutes of Fame"

Andy Warhol once said, everyone will eventually get their "15 Minutes of Fame".

Still waiting for mine …

[–] [email protected] 4 points 1 month ago* (last edited 1 month ago)

Be careful what you wish for. Mine was when half my hometown started telling my mother they saw me stuffing my face with chips in the background of a One News report when I was meant to be in class.

[–] [email protected] 2 points 1 month ago (1 children)

Everyone might get their 15 minutes of fame, but it may not be for a good reason. Try not to be a murderer or an Elon Musk.

You might just be the person that the news videos falling over in the wind to demonstrate how windy it is today. Still counts.

[–] [email protected] 3 points 1 month ago

Given the current ease for anyone to post YouTube or social media content these days, and gaining attention, the quote, originally from around the 1970’s, was quite forward looking to how things have now become.