this post was submitted on 30 Jan 2024
23 points (96.0% liked)

DRS Your GME

1229 readers
1 users here now

ΔΡΣ Central

Community to discuss the DRSGME.org project and resources, and how to spread DRS advocacy and information to GameStop investors around the world.

Have a great idea to spread the word? There are some resources here to get started!

https://www.drsgme.org/free-resources

founded 1 year ago
MODERATORS
 

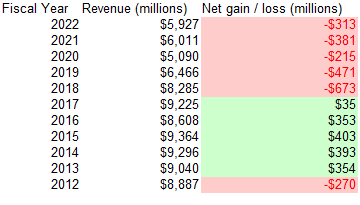
The last time GameStop posted positive full-year earnings was in 2017.

There has been a fair amount of talk of GameStop posting full-year profitability for the 2023 fiscal year, which is definitely within reach, but not guaranteed.

If GameStop posts full year earnings for FY23, it will be the first time in 6 years. It will be a momentous occasion!

It will also demonstrate that the prevailing sentiment put out by mainstream media doesn't reconcile with the reality that this company is not the loser that they want the world to think it is.

all 6 comments
sorted by: hot top controversial new old
[–] [email protected] 9 points 7 months ago

What happened in 2013 and 2017 though

[–] [email protected] 6 points 7 months ago

I want to see that topline grow more. Hopefully hardware sales will be good this year from Nintendo's new thing.

[–] [email protected] 1 points 7 months ago

some more data going back to fiscal year 2005.

Fiscal Year Revenue Net Income Store Count Revenue Per Store Net Income Per Store 10-K
2005 $3,091,783,000 $100,784,000 4490 $688,593.10 $22,446.33 link
2006 $5,318,900,000 $158,250,000 4778 $1,113,206.36 $33,120.55 link
2007 $7,093,962,000 $288,291,000 5264 $1,347,637.16 $54,766.53 link
2008 $8,805,897,000 $398,282,000 6207 $1,418,704.20 $64,166.59 link
2009 $9,077,997,000 $377,265,000 6450 $1,407,441.40 $58,490.70 link
2010 $9,473,700,000 $408,000,000 6670 $1,420,344.83 $61,169.42 link
2011 $9,550,500,000 $339,900,000 6683 $1,429,073.77 $50,860.39 link
2012 $8,886,700,000 -$269,700,000 6602 $1,346,061.80 $40,851.26 link
2013 $9,039,500,000 $354,200,000 6675 $1,354,232.21 $53,063.67 link
2014 $9,296,000,000 $393,100,000 6690 $1,389,536.62 $58,759.34 link
2015 $9,363,800,000 $402,800,000 7117 $1,315,694.82 $56,596.88 link
2016 $8,607,900,000 $353,200,000 7535 $1,142,388.85 $46,874.59 link
2017 $9,224,600,000 $34,700,000 7276 $1,267,811.98 $4,769.10 link
2018 $8,285,300,000 -$673,000,000 5830 $1,421,149.23 $115,437.39 link
2019 $6,466,000,000 -$470,900,000 5509 $1,173,715.74 $85,478.31 link
2020 $5,089,800,000 -$215,300,000 4816 $1,056,852.16 $44,705.15 link
2021 $6,010,700,000 -$381,300,000 4573 $1,314,388.80 $83,380.71 link
2022 $5,927,200,000 -$313,100,000 4413 $1,343,122.59 $70,949.47 link
[–] [email protected] -1 points 7 months ago

Man, when COVID started and GameStop forced their employees to keep working as "Essential" the Internet was RABID against them. Then when they realized they could be the stockholders that were "profiting" from these decisions they switched teams.