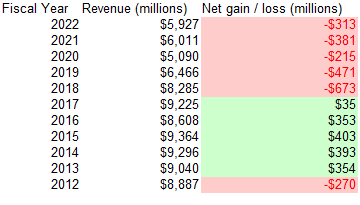
What happened in 2013 and 2017 though
this post was submitted on 30 Jan 2024
23 points (96.0% liked)
DRS Your GME
1228 readers
2 users here now
ΔΡΣ Central
Community to discuss the DRSGME.org project and resources, and how to spread DRS advocacy and information to GameStop investors around the world.
Have a great idea to spread the word? There are some resources here to get started!
https://www.drsgme.org/free-resources
founded 1 year ago
MODERATORS
I want to see that topline grow more. Hopefully hardware sales will be good this year from Nintendo's new thing.
some more data going back to fiscal year 2005.
| Fiscal Year | Revenue | Net Income | Store Count | Revenue Per Store | Net Income Per Store | 10-K |
|---|---|---|---|---|---|---|
| 2005 | $3,091,783,000 | $100,784,000 | 4490 | $688,593.10 | $22,446.33 | link |
| 2006 | $5,318,900,000 | $158,250,000 | 4778 | $1,113,206.36 | $33,120.55 | link |
| 2007 | $7,093,962,000 | $288,291,000 | 5264 | $1,347,637.16 | $54,766.53 | link |
| 2008 | $8,805,897,000 | $398,282,000 | 6207 | $1,418,704.20 | $64,166.59 | link |
| 2009 | $9,077,997,000 | $377,265,000 | 6450 | $1,407,441.40 | $58,490.70 | link |
| 2010 | $9,473,700,000 | $408,000,000 | 6670 | $1,420,344.83 | $61,169.42 | link |
| 2011 | $9,550,500,000 | $339,900,000 | 6683 | $1,429,073.77 | $50,860.39 | link |
| 2012 | $8,886,700,000 | -$269,700,000 | 6602 | $1,346,061.80 | $40,851.26 | link |
| 2013 | $9,039,500,000 | $354,200,000 | 6675 | $1,354,232.21 | $53,063.67 | link |
| 2014 | $9,296,000,000 | $393,100,000 | 6690 | $1,389,536.62 | $58,759.34 | link |
| 2015 | $9,363,800,000 | $402,800,000 | 7117 | $1,315,694.82 | $56,596.88 | link |
| 2016 | $8,607,900,000 | $353,200,000 | 7535 | $1,142,388.85 | $46,874.59 | link |
| 2017 | $9,224,600,000 | $34,700,000 | 7276 | $1,267,811.98 | $4,769.10 | link |
| 2018 | $8,285,300,000 | -$673,000,000 | 5830 | $1,421,149.23 | $115,437.39 | link |
| 2019 | $6,466,000,000 | -$470,900,000 | 5509 | $1,173,715.74 | $85,478.31 | link |
| 2020 | $5,089,800,000 | -$215,300,000 | 4816 | $1,056,852.16 | $44,705.15 | link |
| 2021 | $6,010,700,000 | -$381,300,000 | 4573 | $1,314,388.80 | $83,380.71 | link |
| 2022 | $5,927,200,000 | -$313,100,000 | 4413 | $1,343,122.59 | $70,949.47 | link |
Man, when COVID started and GameStop forced their employees to keep working as "Essential" the Internet was RABID against them. Then when they realized they could be the stockholders that were "profiting" from these decisions they switched teams.
