Map Enthusiasts
3414 readers
20 users here now
For the map enthused!
Rules:
-
post relevant content: interesting, informative, and/or pretty maps
-
be nice
founded 1 year ago
MODERATORS
1
2

3

4
In English, the name of document that entitles someone to drive a vehicle differs, with around generally 6 permutations. Driving/Driver/Driver’s and licence/license.
As a noun, “licence” is generally how you would spell the verb using British English, whereas in American English the noun is spelled the same as the verb; “license”.
Driving vs. “Driver’s” is more subjective in my opinion. It is an authorisation for the act of driving, so it being a “Driving” licence/license is logical. As the same time, the document is in the possession of the driver, so “Driver’s” is also equally as valid. A handful of countries use “Drivers”, which is just sloppy, as it doesn’t make any grammatical sense.
I tried my best to compile data on all countries which mention the document in English. In Australia, Canada and the US, licences are issued by state/territory, so I’ve included their differences.
I only included countries for which an English version of the name is on the actual licence. On many EU licences, the English is written very faintly on backgrounds. For many smaller countries I couldn’t find examples of the document. In South America, ‘Licencia de conducir” was most common, but a few permutations in Spanish. On the African continent, the French “Permis de conduire” was also fairly common. Multi-language licences with English, French and other languages was also common. I only picked out the English translation for this map.
In my subjective opinion, "Driving licence" feels most right; but as this map illustrates, it’s a diverse interpretation. For licence/license, the difference between C/S is almost indistinguishable in a small font and in spoken word. Some evident US/UK influence on the map.
https://old.reddit.com/r/MapPorn/comments/1fvftxw/drivingdrivers_licencelicense_oc/

5
7
8
You might not see it if you have specific languages selected and not catalan
cross-posted from: https://lemm.ee/post/44181347
Source: https://old.reddit.com/r/catalunya/comments/1fwo5nn/he_fet_un_mapa_dels_serveis_ferroviaris_de/
9
38
Source on UK ceding the islands to Mauritius
Wikipedia article on Chagos Archipelago
Another map displaying the main islands zoomed in.


10
Edit: source with some more info
https://www.nytimes.com/interactive/2015/12/24/upshot/24up-family.html


12
116
13
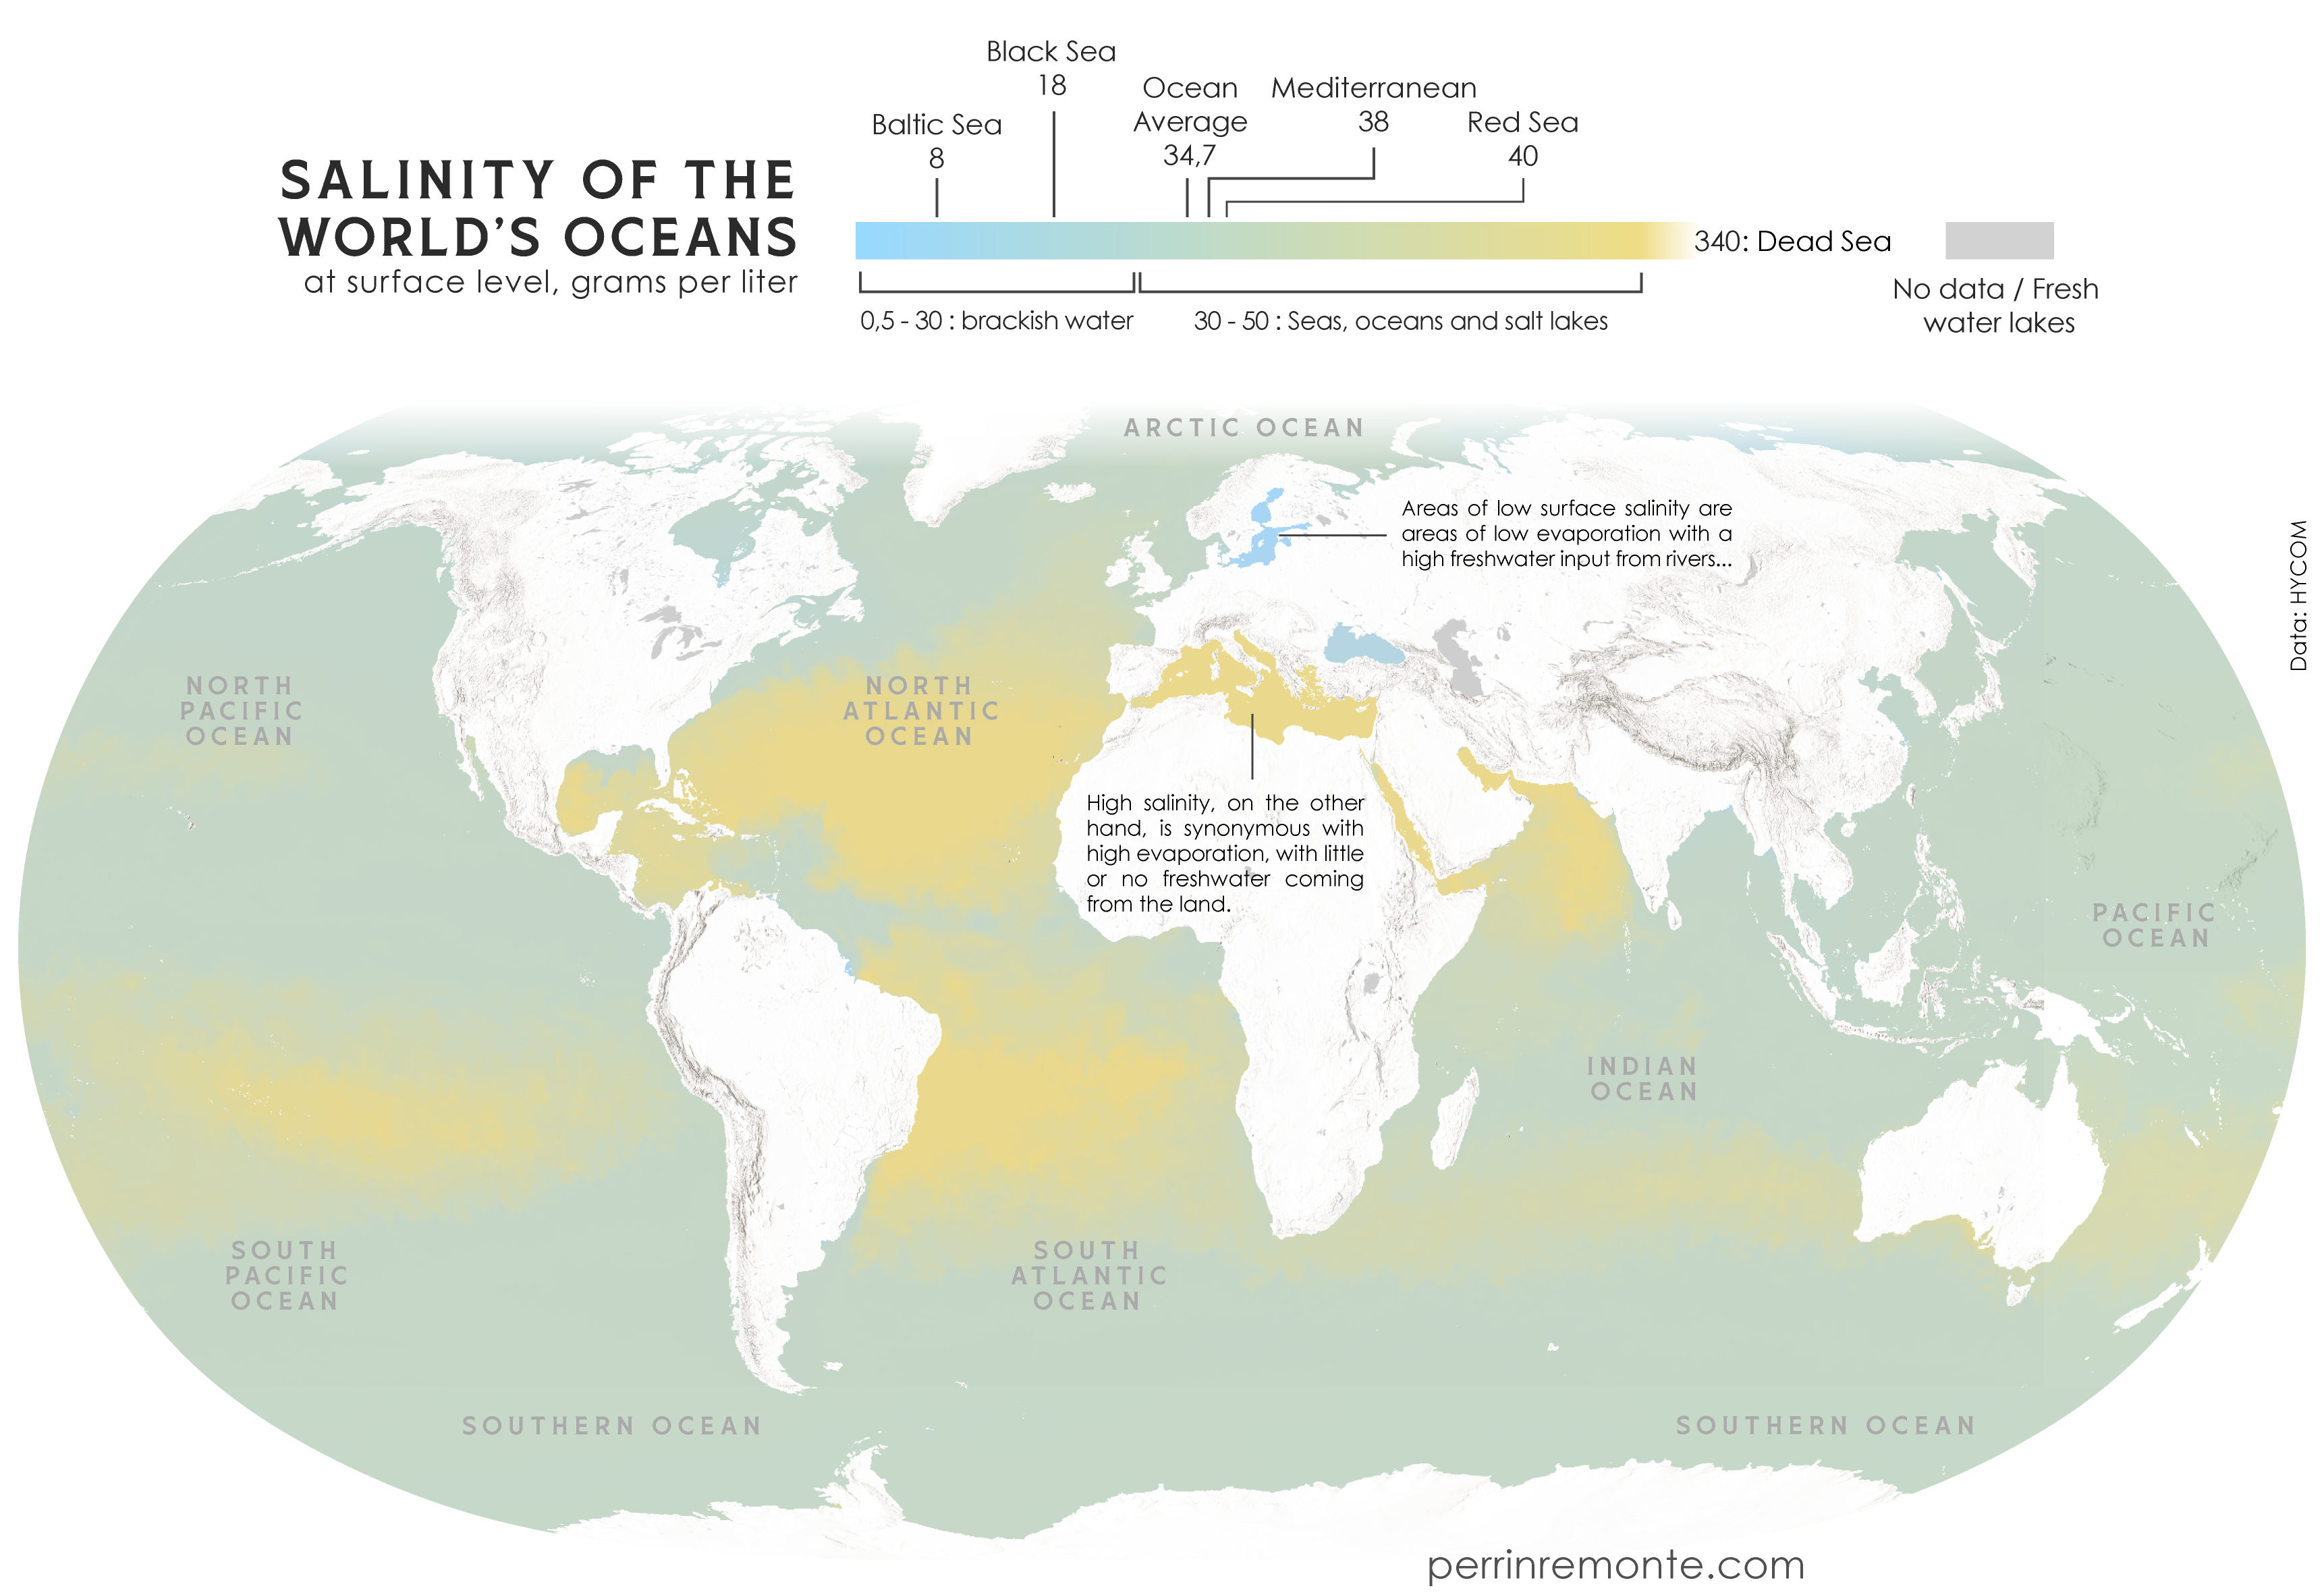
https://www.perrinremonte.com/home-bis
Lower res version with updated scale
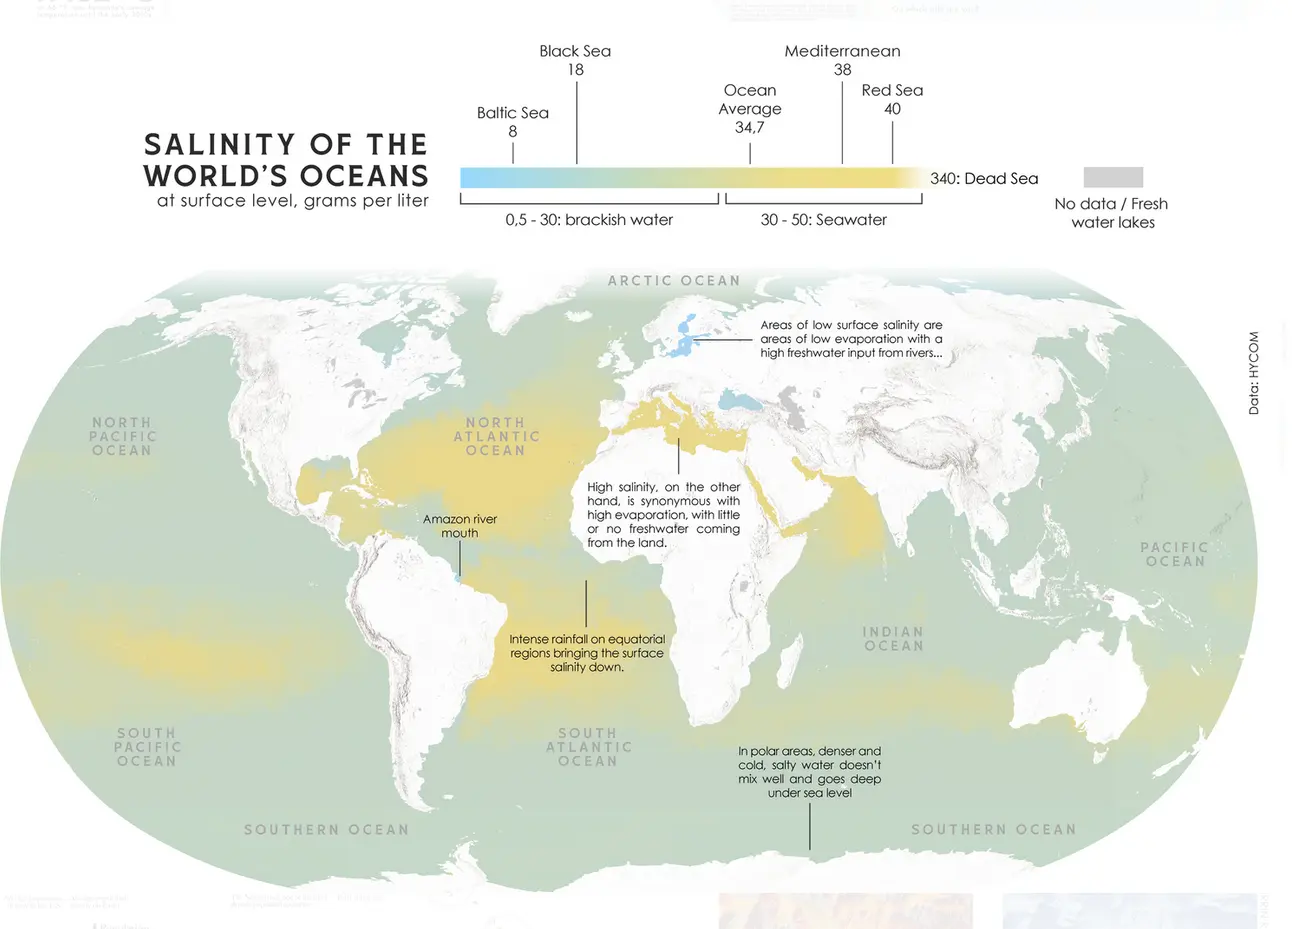
https://www.perrinremonte.com/expe-eng?itemId=m21a3at8pndyfg97b4lgs89eem8gg4
14
121
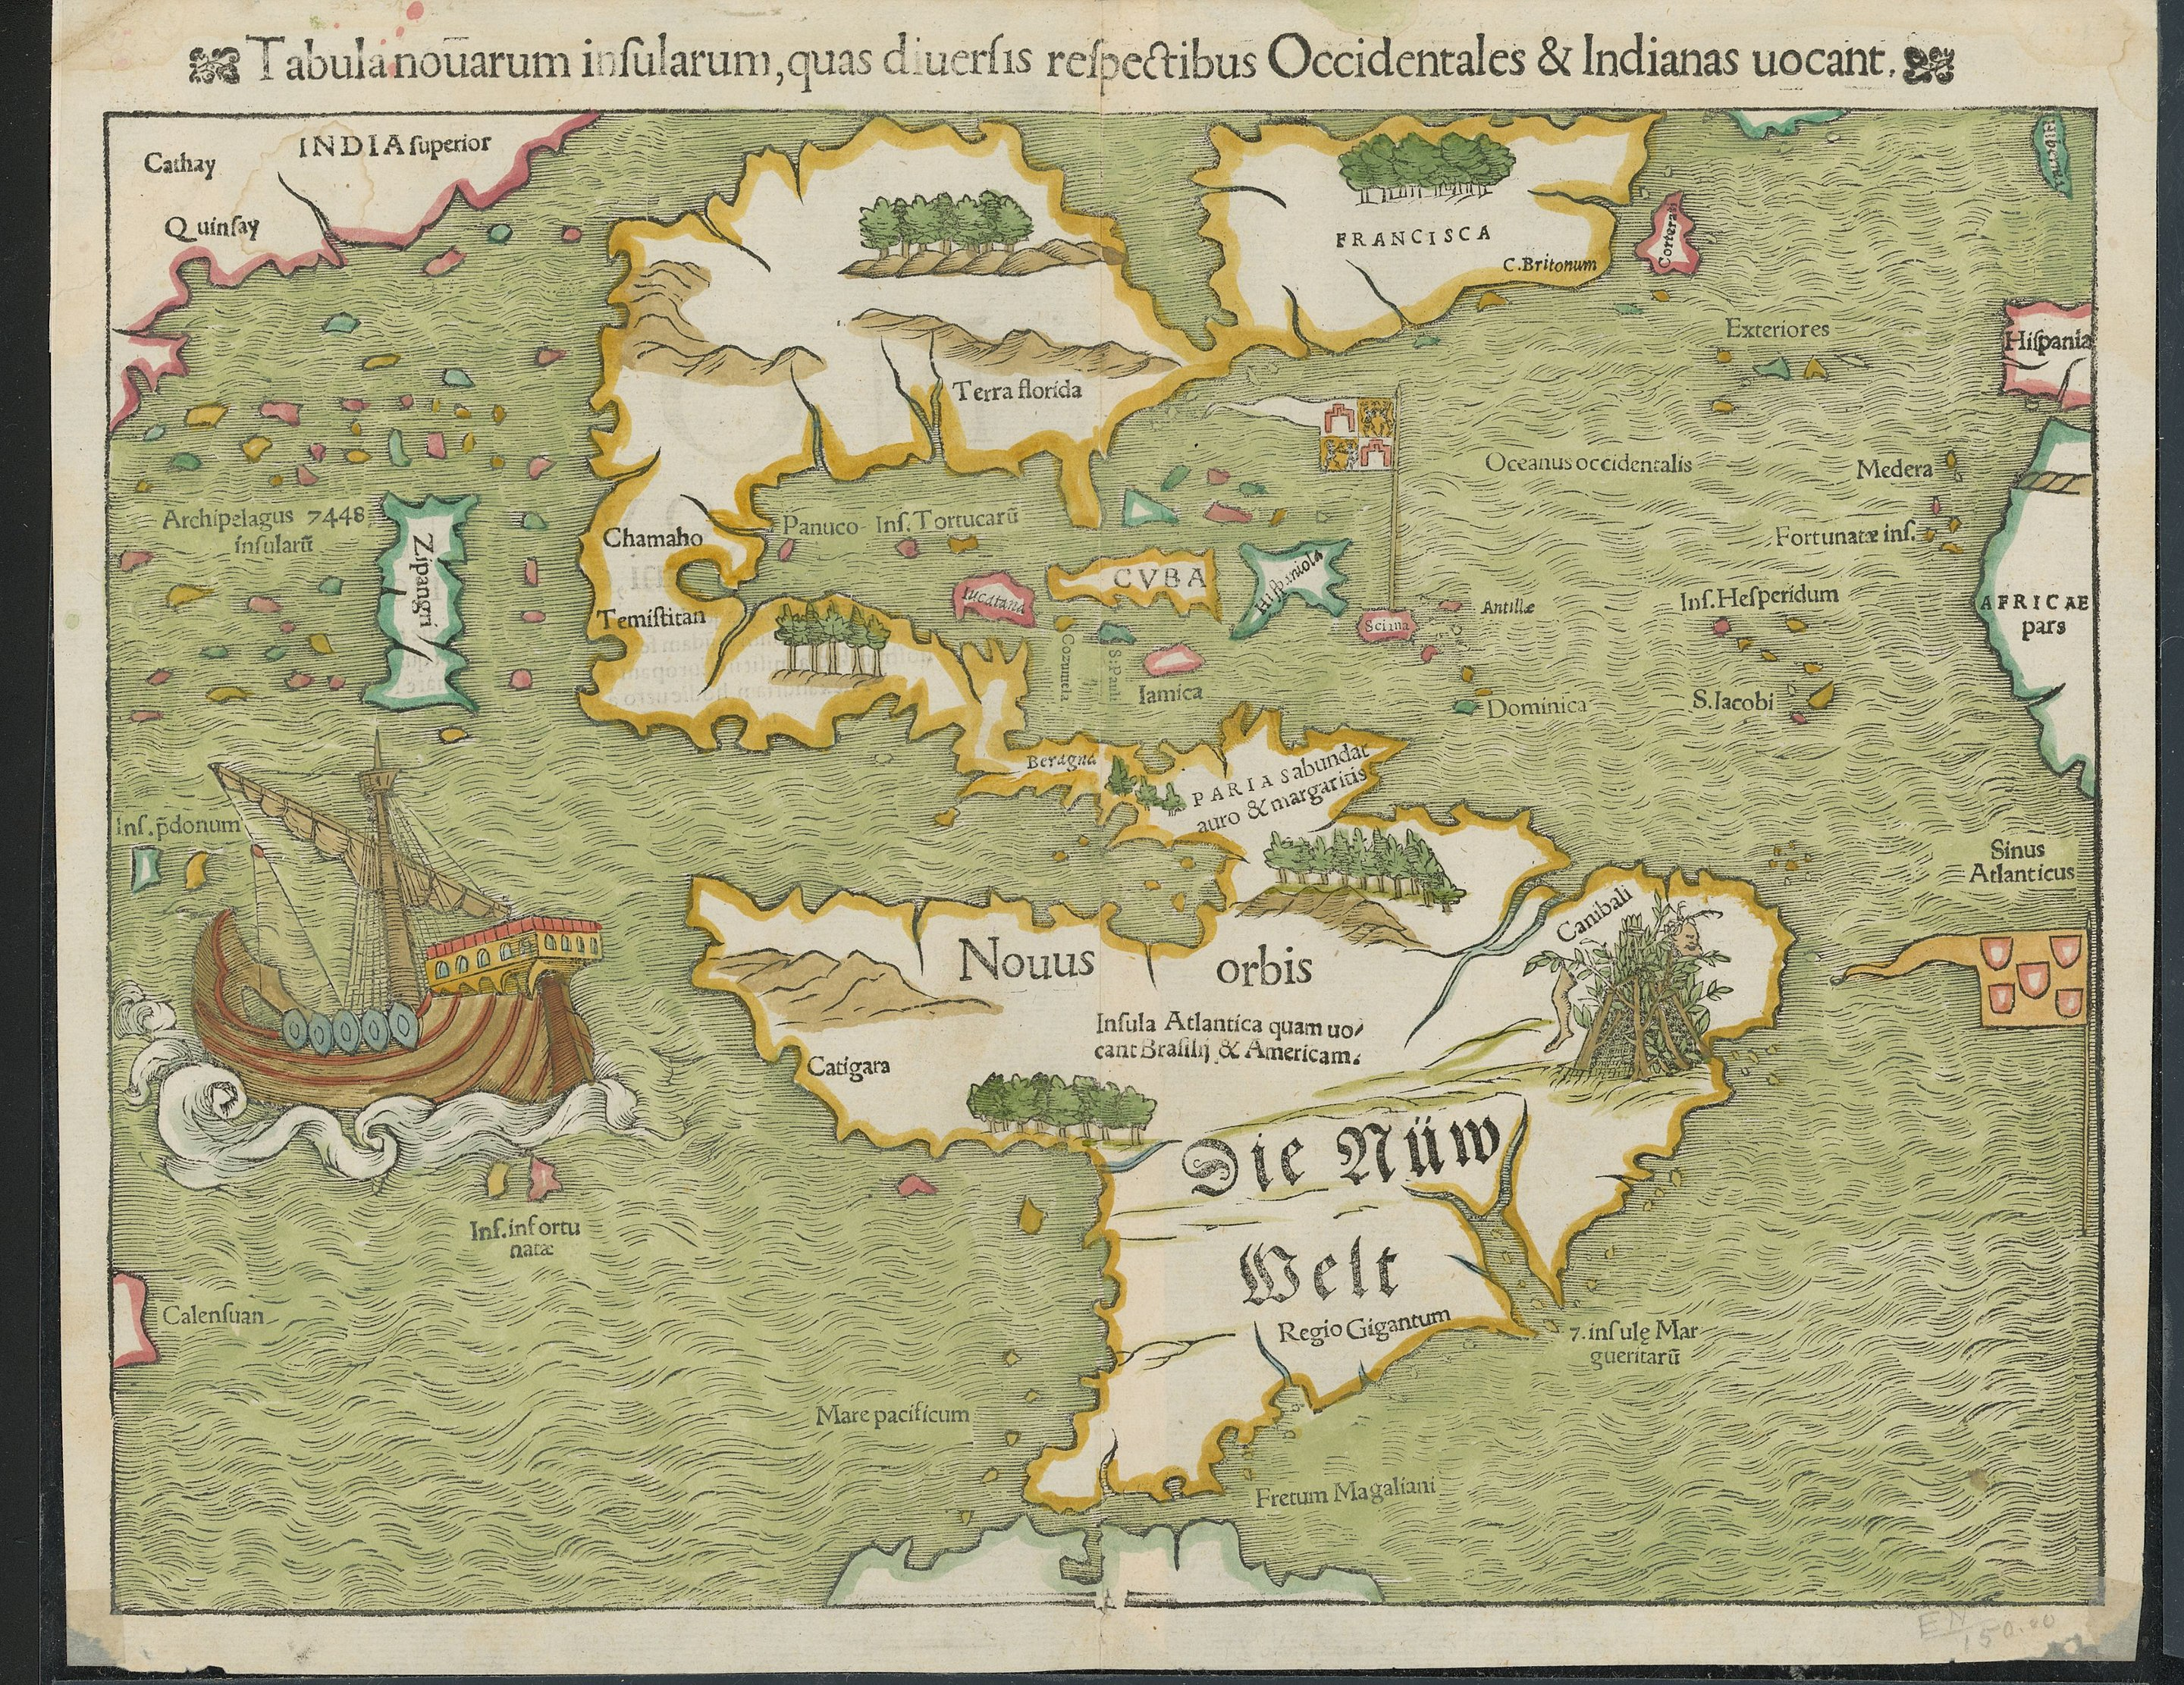
cross-posted from: https://lemmy.world/post/19568259
More info here: https://exhibits.stanford.edu/ruderman/catalog/mz230kn1495


18
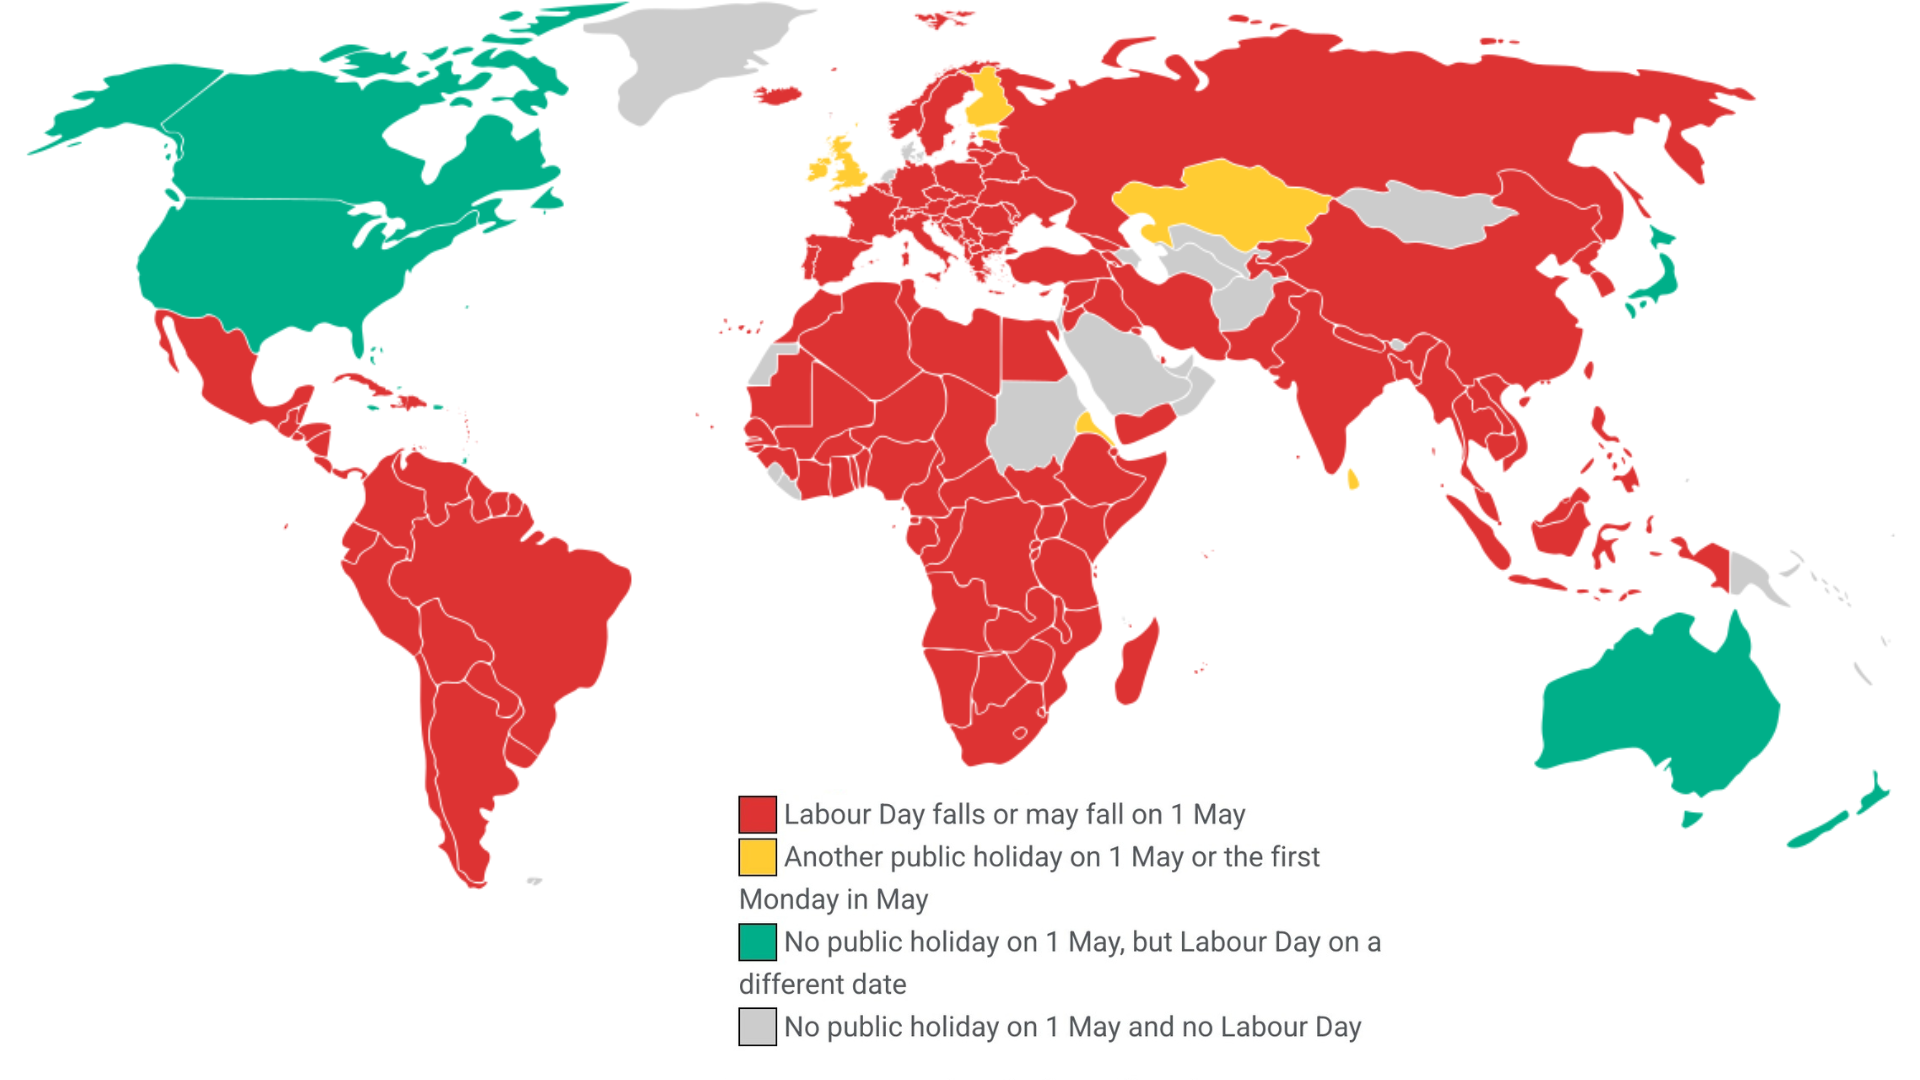
Most of the world celebrates it on 1st May.

21
128
24
25
view more: next ›