It would be good to know distance traveled, but that's likely impossible to track with any accuracy. Outside the lowest quintile I wouldn't be surprised if the 2-4x increased spending also included 2-4x as many miles traveled.
It would be good to know distance traveled, but that's likely impossible to track with any accuracy. Outside the lowest quintile I wouldn't be surprised if the 2-4x increased spending also included 2-4x as many miles traveled.
These things go hand in hand. The reason people need to own a car is precisely because of a lot of cities don't have amenities within walking distance. Hence you end up doing more travel if you live in a place like that.
Do you have the source for that graph?
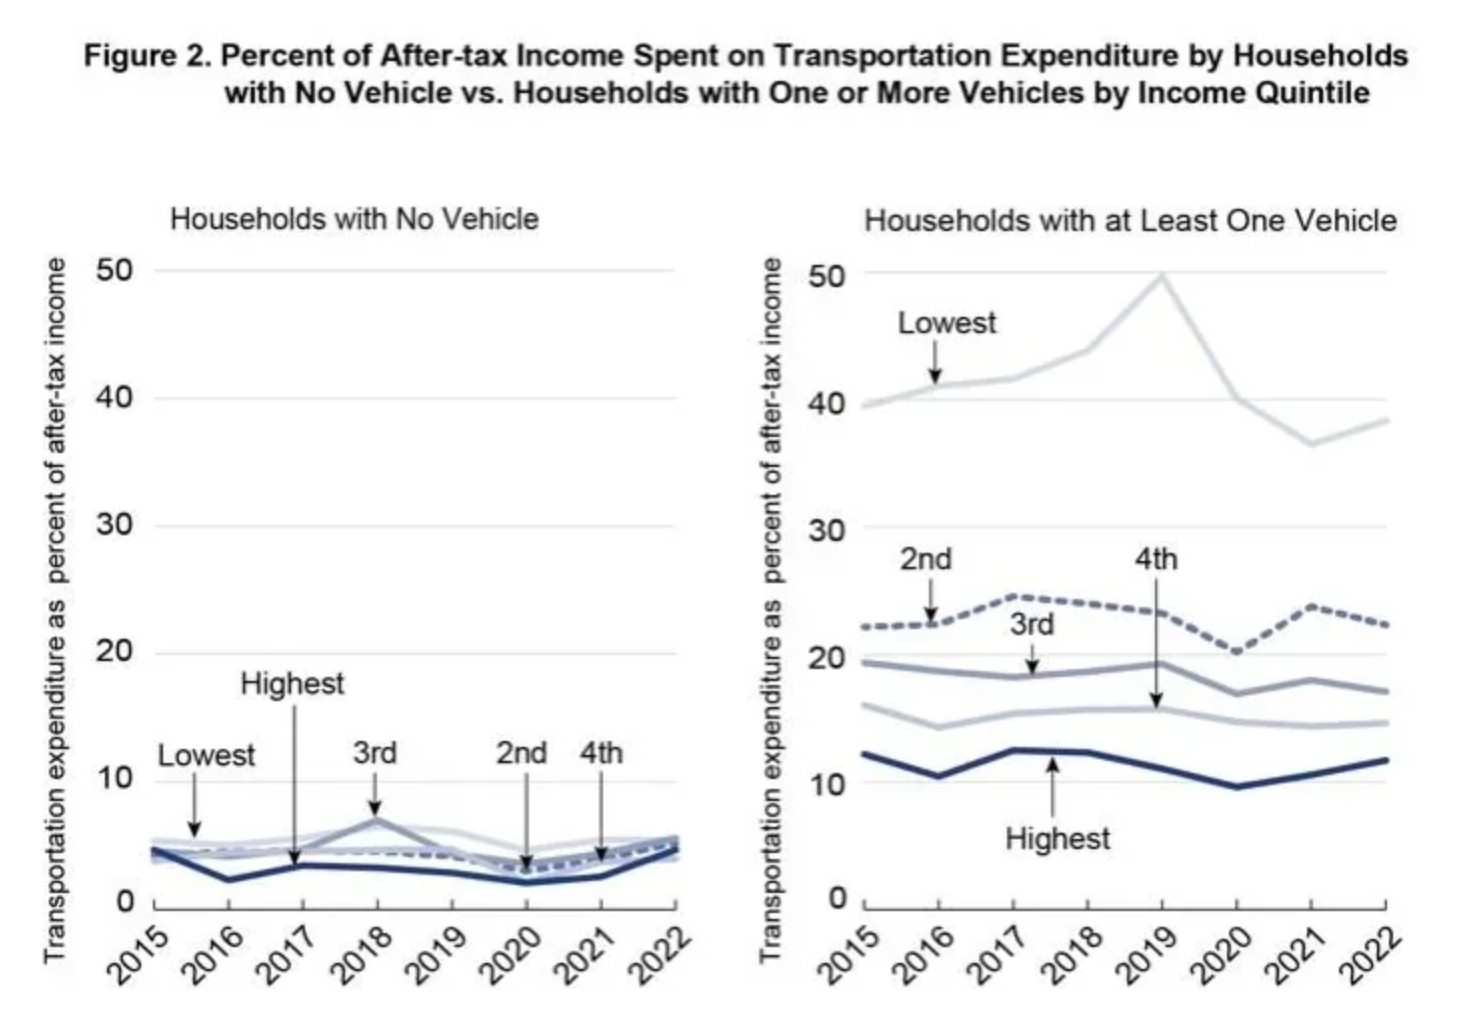
Is income quintile using the same cutoff on botj graphs or computed for the two populations seperately? Shocked there's almost no difference in transportation costs in the no vehicle group. Is there more geographic variance?
(I'm certain public transit is cheaper than car ownership, just that part of the data looks odd, might be a visualization issue)
some more details here https://data.bts.gov/stories/s/Transportation-Economic-Trends-Transportation-Spen/ida7-k95k/
The income cutoff is the same, but the size of each quintile is radically different in the no car section. Only 3% of the top 2 quintiles don't own a car, while it's 11-17% in the other 3 quintiles. The data for the top two quintiles is basically irrelevant.